Speed
Speed shows two different measurements and keeps them apart on purpose. Field data (CrUX) is what real Chrome users experienced in the last 28 days; it is what Google uses for the page-experience signal. Lab data (Lighthouse) is one simulated load on a slow phone; it is for finding causes, not for grading.
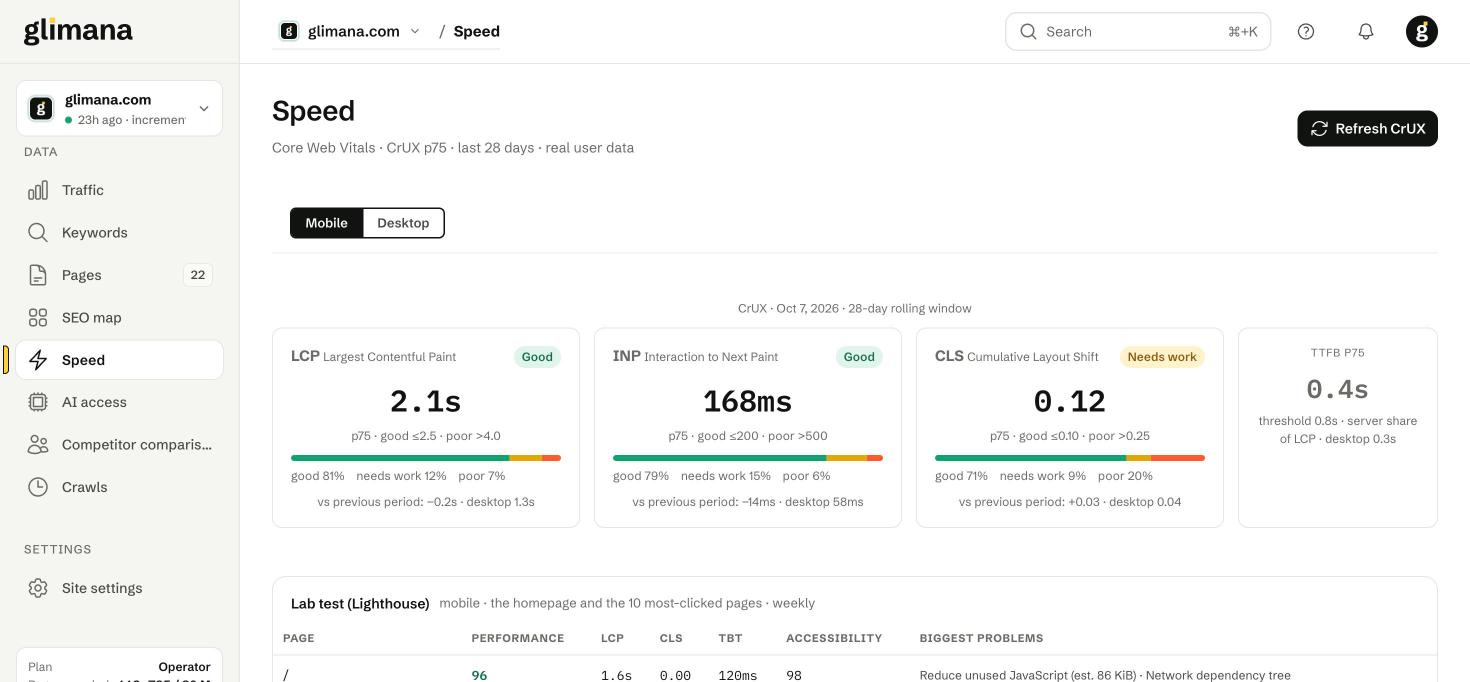
Field data (CrUX)
The three Core Web Vitals, each at the 75th percentile (p75) over the last 28 days, mobile by default (switch to Desktop at the top):
| Metric | Good | Poor | What it measures |
|---|---|---|---|
| LCP Largest Contentful Paint | ≤ 2.5 s | > 4.0 s | When the main content became visible. |
| INP Interaction to Next Paint | ≤ 200 ms | > 500 ms | How quickly the page reacts to taps and clicks. |
| CLS Cumulative Layout Shift | ≤ 0.10 | > 0.25 | How much the layout jumps while loading. |
Each card shows the p75 value, the share of page loads that were good / needs work / poor, the change against the previous 28-day window and the desktop value for comparison. TTFB is shown as well because it is the server's share of LCP; the threshold is 0.8 s.
A page or site passes Core Web Vitals when all three are good. The status label on each page in the Slowest pages table follows Google's definitions exactly: good if all three are good, needs work if any is between the thresholds, poor only if a metric is past the poor threshold.
CrUX only returns data for pages and origins with enough Chrome traffic; "—" means not enough data, not zero. Refresh CrUX fetches the latest window now; otherwise it refreshes weekly.
LCP breakdown
Under the cards, "Why is LCP x s?" splits the lab LCP into its phases — time to first byte, resource load delay, resource load time, element render delay — and names the LCP element (for example div.hero > h1). The two largest phases are where to work. The breakdown comes from an unthrottled PageSpeed run, so it can differ from both the CrUX value and the throttled Lighthouse figure in the table below.
By section and slowest pages
By section aggregates URL-level field data per site section with its 28-day clicks, so you can see whether a slow section is also a busy one. Slowest pages lists the pages with URL-level CrUX data, sorted by LCP, with INP, CLS, TTFB and the status label.
Lab tests (Lighthouse)
Once a week (Saturday morning) Glimana runs Lighthouse on the home page and the ten most-clicked pages, mobile, simulating a mid-range phone on slow 4G. The table shows the performance score, LCP, CLS, TBT, the accessibility score and the three biggest audits per page ("Render-blocking requests (est. 410 ms)"). The accessibility score feeds the Lighthouse accessibility rule; if no run happened in 14 days that rule is marked not running.
Which number does Google use?
The field data. Lighthouse scores are not a ranking input. Use them to find what to change, then watch the CrUX cards move over the following weeks.