Keywords
Everything on this screen is Search Console query data for the last 28 days, compared with the 28 days before. There is no third-party search volume, no "difficulty" score, no estimated traffic — only what Google reported for your site.

Gained and lost
Two cards summarise the period: queries that gained clicks and queries that lost them, each with the page that ranked, the position move (old → new) and the click difference. The headline counts (for example "312 queries · +1,106 clicks") are the totals for the whole set, the lists show the top five. Both cards use the same filters as the table below.
Tabs
| Tab | Shows |
|---|---|
| All queries | Every query with at least the minimum impressions. The sidebar badge shows the unfiltered total. |
| ★ Tracked | Queries you starred. Tracked queries get their own summary (top-3 and top-10 counts, average position and clicks vs the previous period). |
| Top 3 / 4–10 | Position buckets. |
| Opportunity 11–20 | Queries just off page one — the usual place to find a page to improve. |
| Falling | Queries whose position or clicks fell meaningfully against the previous period. |
Filters
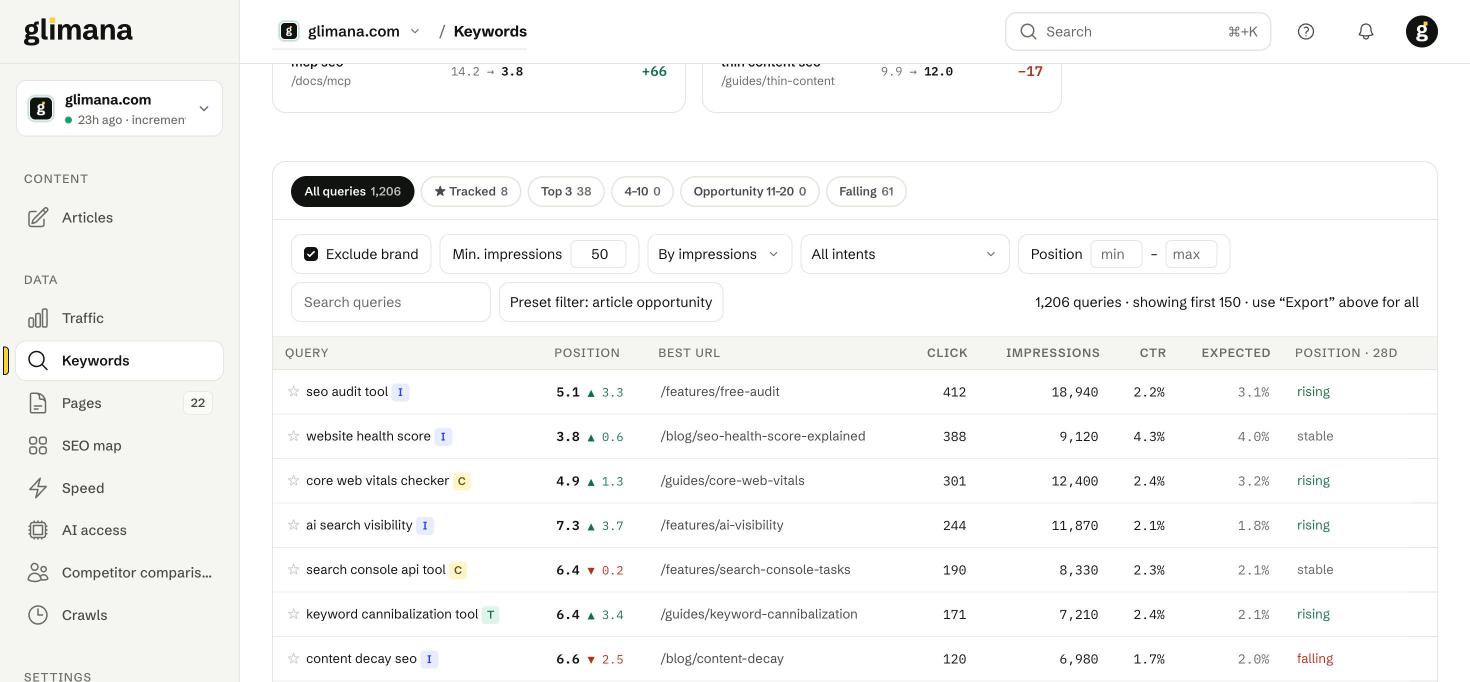
Exclude brand removes queries matching the brand names from site settings. Min. impressions (default 50) keeps noise out; lower it on small sites. Sort by impressions, clicks, position or CTR gap. All intents filters by the intent label (I informational, C commercial, T transactional, N navigational) that Glimana assigns from the query pattern. Position min–max narrows a bucket. The search box matches query text; it also accepts a page path to list the queries of one page.
Preset filter: article opportunity applies the same conditions the Articles screen uses (impressions but no page better than position 15, brand excluded).
The table
| Column | Meaning |
|---|---|
| Query | With the star to track it and the intent badge. |
| Position | Average position with the change against the previous 28 days. |
| Best URL | The page that received the most clicks for the query. |
| Click / Impressions / CTR | Search Console totals. |
| Expected | The CTR a query at this position should earn on this site. |
| Position · 28d | rising / stable / falling from the daily series. |
Expected CTR
Expected CTR is a site-specific curve: Glimana fits a curve to your own queries (those with at least 50 impressions) and blends it with a global curve when there are fewer than 30 data points in a position. A query whose real CTR is far below the expected value at its position — at least 500 impressions, inside the top 10, gap of at least 1 point, at least 20 clicks to gain, and CTR below 70% of expected — becomes a CTR opportunity: the title and description are not earning the clicks the position deserves. Queries in the top 3 are left alone, because SERP features explain most gaps there. The dashboard's "n CTR opportunities" counts these.
Export and limits
The table shows the first 150 rows with a Show 150 more button; Export at the top downloads every query in the current filter as CSV. Search Console itself caps the data it hands out, so very large sites see the queries Google chose to report, which is the same set as in Search Console's own interface.
Bing keyword ideas
If Bing Webmaster is connected, the bottom of the screen lists keyword ideas — topics in your field that you do not appear for at all. Search Console cannot tell you about queries you never ranked for; this is the one Bing signal that proved useful, which is why it is here and nothing else from Bing is.