Dashboard
The dashboard is the one screen that answers "how is this site doing and what should I do next". Everything on it is computed live from the last crawl and the latest Search Console fetch; the subtitle under the greeting tells you how fresh each source is.

Period
7 / 28 / 90 days changes the Search Console window for the KPI cards, the chart, sections and top gaining pages. The comparison is always the same length of time immediately before (90 days vs the previous 90). Position distribution and "Do this week" have their own fixed windows, stated in their headers.
SEO score
The score (0–100) blends six measured parts; the four you can act on are shown on the card:
| Part | Weight | Where it comes from |
|---|---|---|
| Health | 30% | Open crawl issues weighted by severity — the same number as the Issues page. |
| Content | 20% | Content rules only (titles, descriptions, thin and duplicate content, structured data). |
| Visibility | 15% | Share of your tracked queries on page one and their trend. |
| Speed (CWV) | 15% | CrUX p75 for LCP, INP and CLS on mobile. |
| Backlinks | 10% | Not shown on the card; counted only when a backlink source is connected. |
| AI access | 10% | Whether the bots you care about can read the site (see AI access). |
"—" means the part cannot be measured yet (no CrUX data for a low-traffic site, no tracked queries in the first days). The line under the grade names the open task that would raise the score the most; it is the same task as row one in "Do this week" unless a higher-scoring task has no measured clicks.
KPI cards
Organic clicks and Impressions are Search Console totals for the period, with the change against the previous period as a badge. Average position is impression-weighted; the badge shows the change in positions (▲ 1.6 means you moved up 1.6 places on average). Under the impressions card you also see the site CTR and how many CTR opportunities the keywords screen currently lists — queries where your CTR is clearly below what your position should earn.
The "queries on page one" line counts queries with at least 50 impressions in the window, brand included, in positions 1–10. It is the same count as the first two buckets of the position distribution card.
Organic clicks and impressions chart
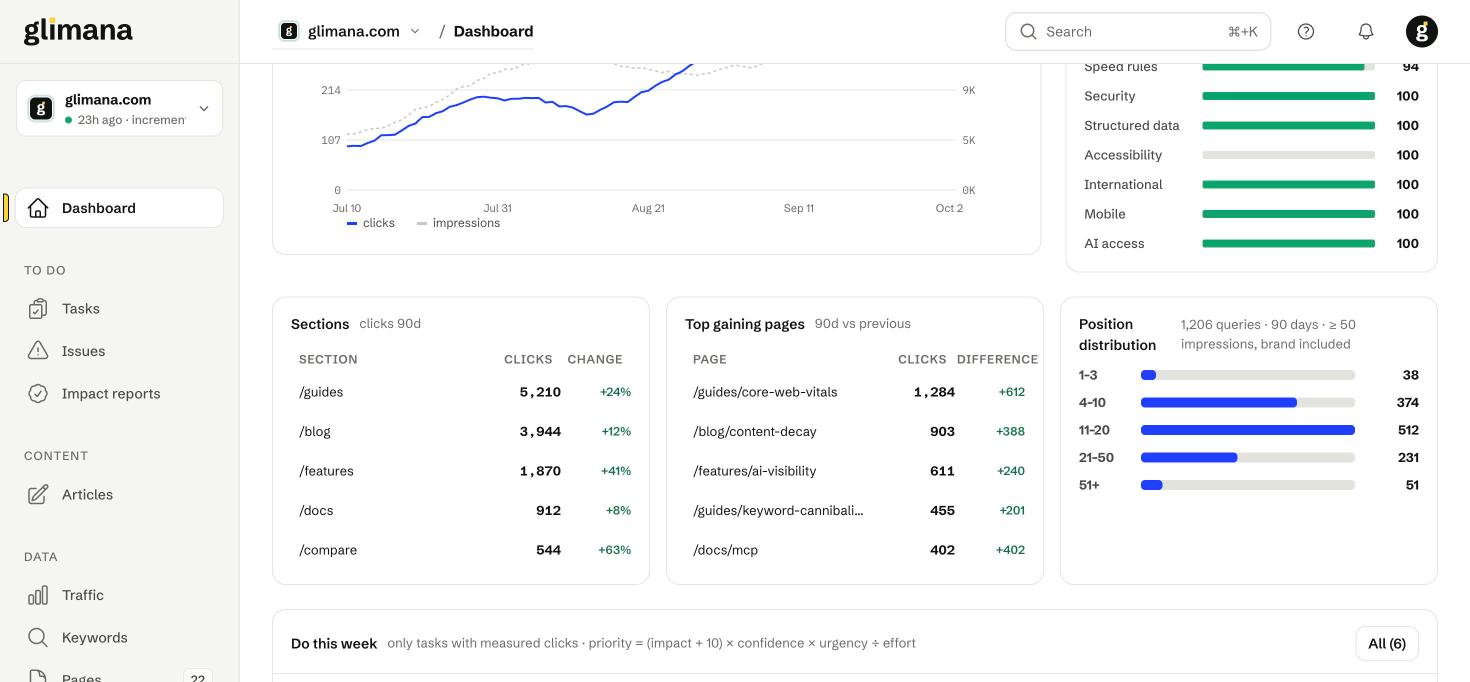
The blue line is clicks (left axis), the dotted grey line impressions (right axis). Vertical markers are chart notes: Glimana adds one automatically for each full crawl, each article published through Glimana and each confirmed Google update; you can add your own with the Chart notes button (a redesign, a migration, a campaign). Notes are per site and appear on the Traffic chart too.
Health by category
Each category is scored 0–100 from its open issues. "not running" means the category depends on an outside source that has not delivered yet — most often Accessibility, which needs a Lighthouse run in the last 14 days. A category that is not running is excluded from the health score rather than counted as 100, and a banner above the cards says so.
Sections and top gaining pages
Sections groups clicks by the first path segment (/blog, /guides) so you can see which part of the site carries the traffic and how each part moved. Top gaining pages lists the pages whose clicks grew the most against the previous period; a page that is new to Search Console shows its whole total as the gain.
Position distribution
Queries with at least 50 impressions in the last 90 days, bucketed by average position. A healthy site has a large 4–10 bucket and a growing 1–3 bucket; a large 11–20 bucket is where the keywords screen's Opportunity tab lives.
Do this week
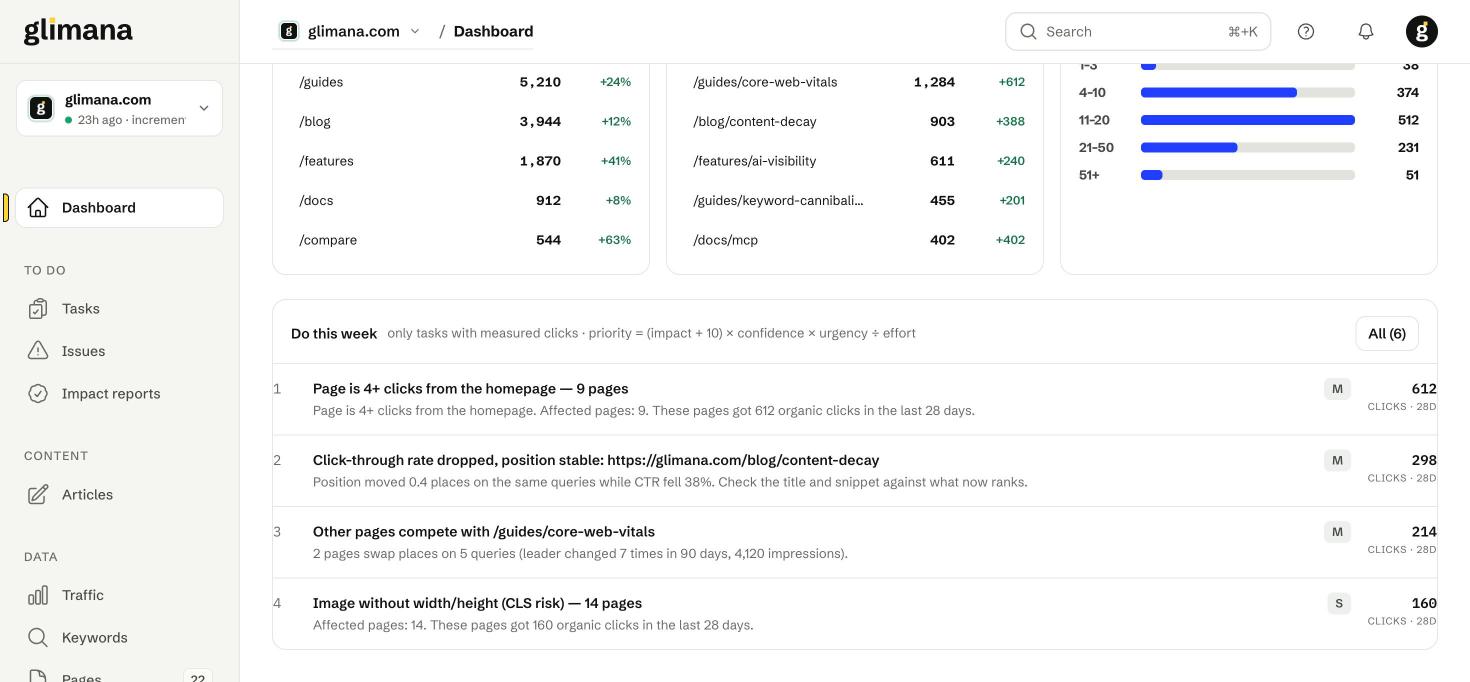
The shortlist shows only tasks whose affected pages have measured clicks in the last 28 days, ranked by the same priority as the Tasks page: (impact + 10) × confidence × urgency ÷ effort. The "+10" is a floor so that a technical task on a zero-click page still has a rank, but such tasks stay on the full list rather than here. "All (n)" opens the Tasks page.
Share and PDF report
Share creates a read-only link to a report view of this dashboard that does not require a Glimana login — useful for a client or a manager. Links can be revoked from the same dialog. PDF report downloads the monthly report for the current period; the same PDF is emailed on the 1st of each month if you leave that on under Notifications. If you set a name, logo and accent colour under Report branding, both the shared view and the PDF carry your brand instead of Glimana's.