Alerts and notifications
Alerts are the things that should not wait for your next visit: a traffic drop, a connection that stopped fetching, a crawl that found a critical issue, a measurement result. Everything else stays in the panel.
What raises an alert
| Alert | Trigger |
|---|---|
| Traffic drop | Weekly organic clicks fall more than 25% and more than three standard deviations below the eight-week baseline (minimum 50 clicks). A Discover drop uses stricter thresholds. The last two days are skipped because Search Console has not published them yet. |
| Traffic spike | The mirror image, four standard deviations up — informational. |
| Fetch stopped | The Search Console or GA4 job missed two runs in a row. |
| Critical issue | A crawl found a critical rule: site-wide noindex, home page error, robots blocking Googlebot, 5xx to search engines, redirect loops on busy pages. |
| Crawl finished | Full crawls only, with the health score and the issue delta. |
| Impact measured | A content task's 31-day measurement is in. |
| Tasks closed on their own | Grouped into one line per night. |
Where alerts appear
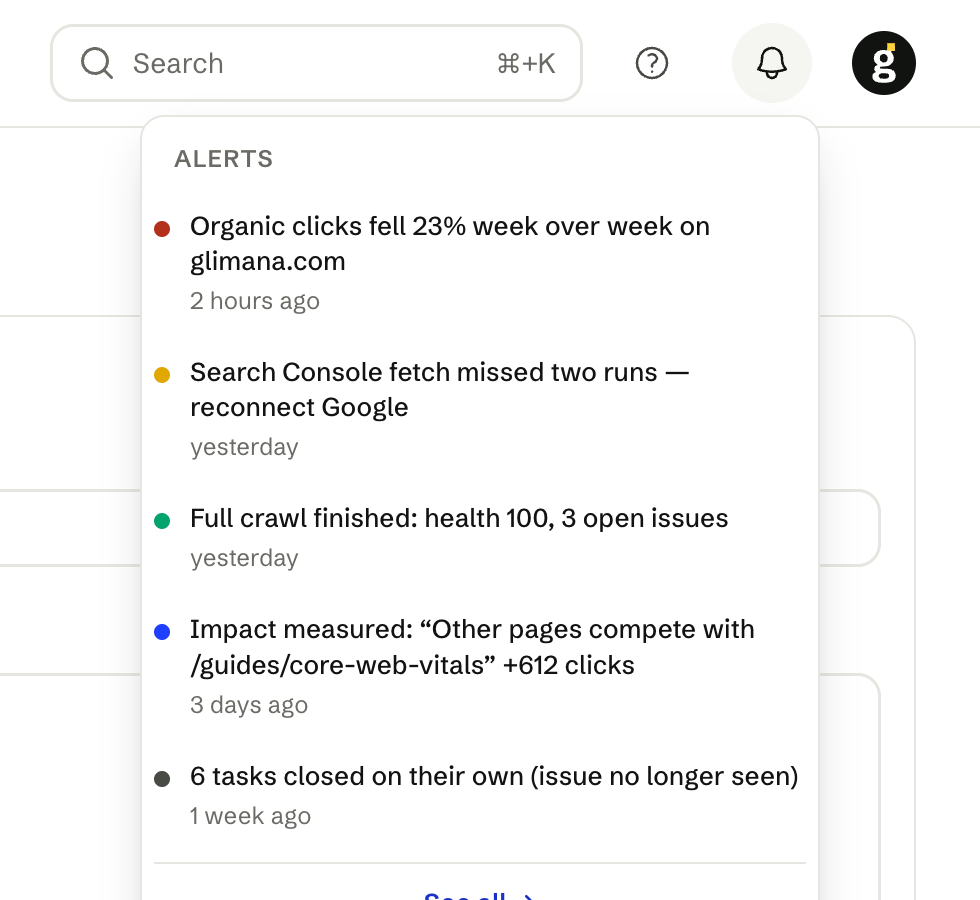
The bell in the top bar lists the newest alerts for the current site; the badge counts unseen ones. See all opens the Alerts page with the full history, an unseen only filter and export. Opening the page marks alerts as seen.
Routing
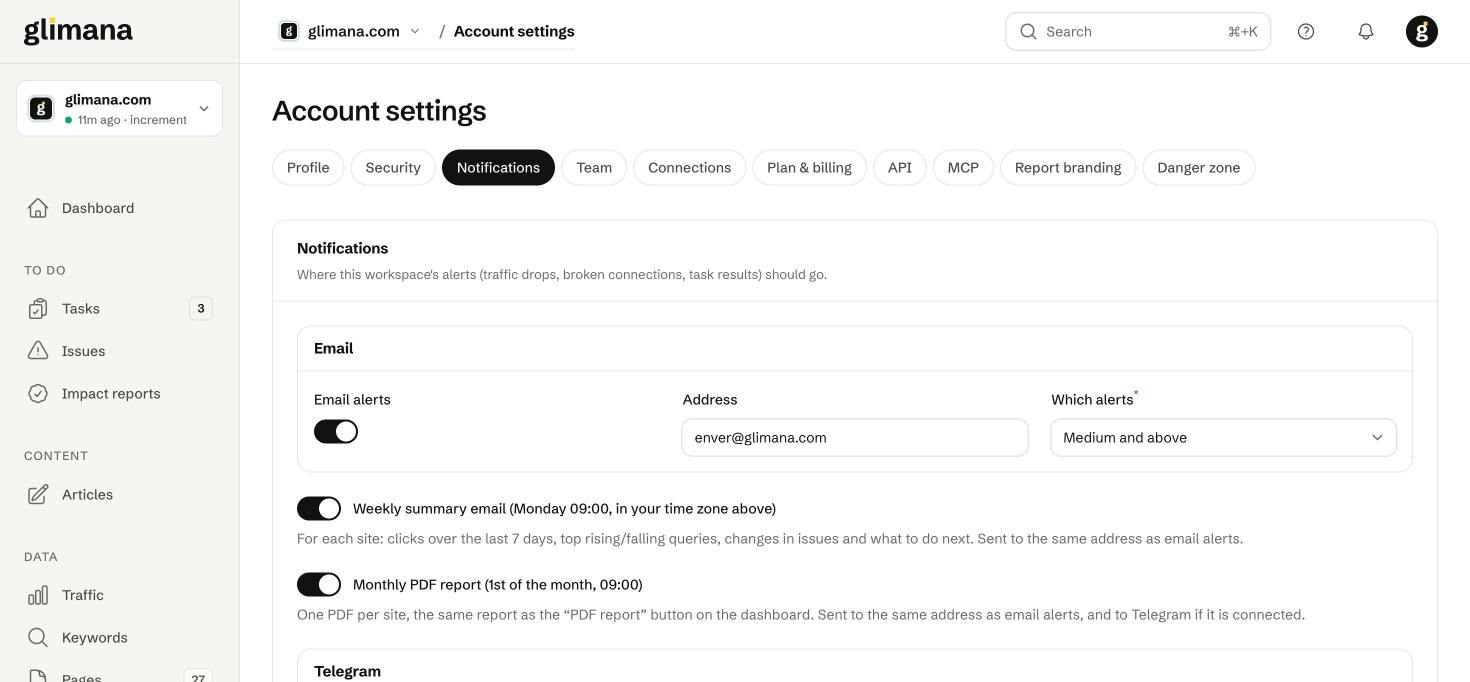
Settings live under avatar → Account settings → Notifications and apply to the whole workspace.
Email alerts — on/off, the address, and the minimum severity (Medium and above by default; Critical only for a quiet inbox). Alerts go to the owner and admins.
Weekly summary email — Monday 09:00 in your time zone, one section per site: clicks over the last 7 days, top rising and falling queries, issue changes and the next three tasks.
Monthly PDF report — the 1st of the month at 09:00, one PDF per site, the same document as the dashboard's PDF button with the sections you selected there, carrying your report branding if set.
Telegram — connect a bot token and chat ID to receive alerts and the monthly PDF in a Telegram chat or channel. Useful for agencies that keep a channel per client.
Keep the bell for action
A good alert configuration is one where every bell item makes you do something. If you find yourself ignoring "crawl finished" lines, set email to High and above and leave the bell for the rest.